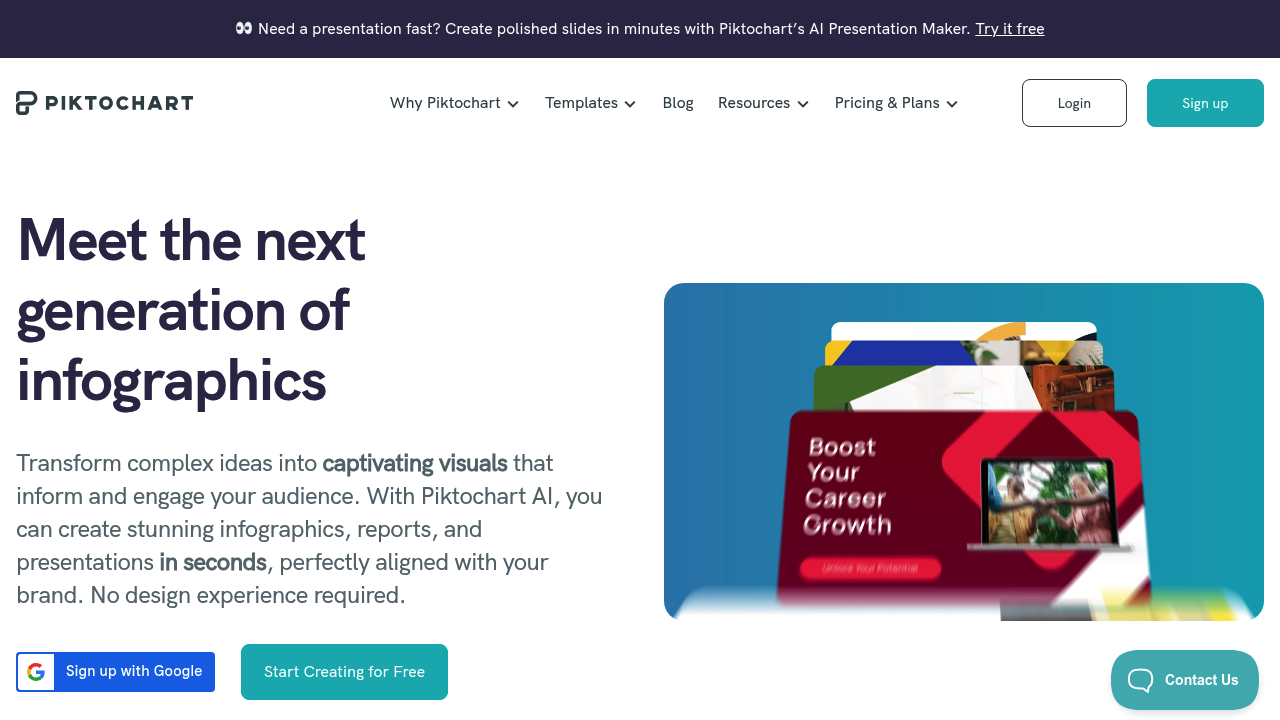
Piktochart is a visual communication platform for building infographics, presentations, reports, ebooks and videos. Its AI tools turn data and ideas into designs aligned with a brand, and Pikto AI Studio can produce video from a typed description of the scene, tone and people. More than 34 million users have created over 220 million visuals on it. Users start free and need no design experience.
Teachers, instructional designers, nonprofit staff, researchers, small business owners, marketers and communications teams make up the audience. People who would otherwise go to Photoshop or Illustrator use blocks and templates to get a clean layout quickly, and customers describe replacing outsourced graphic support. Organizations with several contributors work in a shared workspace that keeps designs on-brand. Beginners can create a presentation in minutes through the AI Presentation Maker.
Typical projects include turning survey results into an infographic, assembling a long-format guide that is repurposed as a whitepaper or lead magnet, and building project databases that people read as visual overviews. Educators make classroom materials, public-interest groups explain policy data, and sustainability brands build educational content for social media. Piktochart also produces slide decks, reports and ebooks from the same content, and customizable block sizes let designers reshape a layout when the first direction does not fit. Short videos can be created without a production budget, using a text prompt to describe the shot. Reports and ebooks can reuse the same visuals, so one set of assets supports several formats for different audiences.