
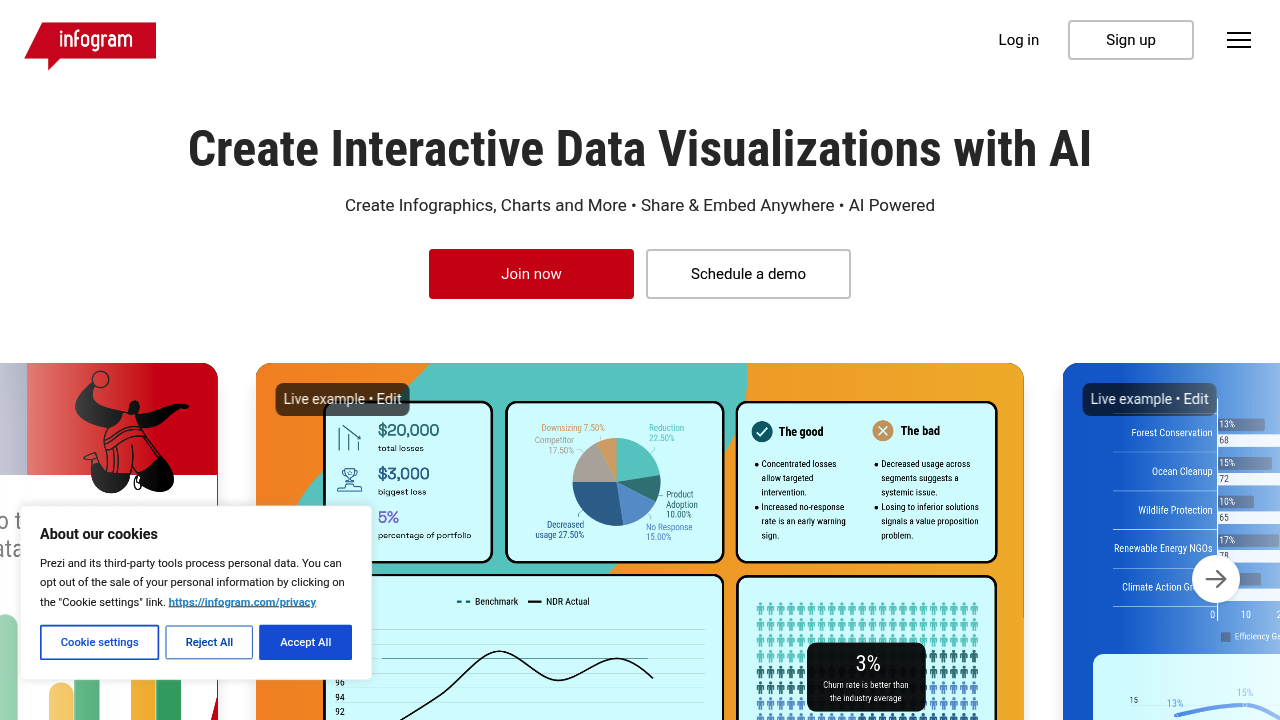
Infogram is an online tool for building interactive infographics, charts, maps, reports, dashboards and slides, with AI support throughout. The library holds 35+ customizable chart types and 800+ maps on paid plans, along with templates, animations, custom tooltips and a royalty-free asset library. Projects can be shared by link or embedded on websites, blogs and presentations without coding, and they update automatically when edited. A Basic plan is free, and paid plans start at $19 per month for Pro when billed yearly, rising to Business at $67 and Team at $149.
The product is aimed at writers, researchers, designers, marketers and managers who need to turn data into visuals. Journalists and bloggers use it to publish interactive content, marketers build branded reports, and managers present business insights. Business adds brand kits with your own logo, colors and fonts, basic analytics and SQL connectors, while Team supports 3-10 users with real-time collaboration, commenting and engagement analytics. Enterprise adds SSO, API support, a 99.9% uptime SLA, and custom branded themes for 10+ users. Discounts are offered for educational organizations, nonprofits and startups.
A newsroom can import a spreadsheet, choose a chart, add tooltips and embed the result in an article. A marketing team can assemble a branded annual report with consistent fonts and colors. An analyst can connect live data to a dashboard, and a manager can export slides or download MP4 and GIF versions of an animated chart. Researchers can visualize complex data for sharing, and designers can convert images into data with the AI features. The company says it is trusted by more than 10 million users worldwide.