
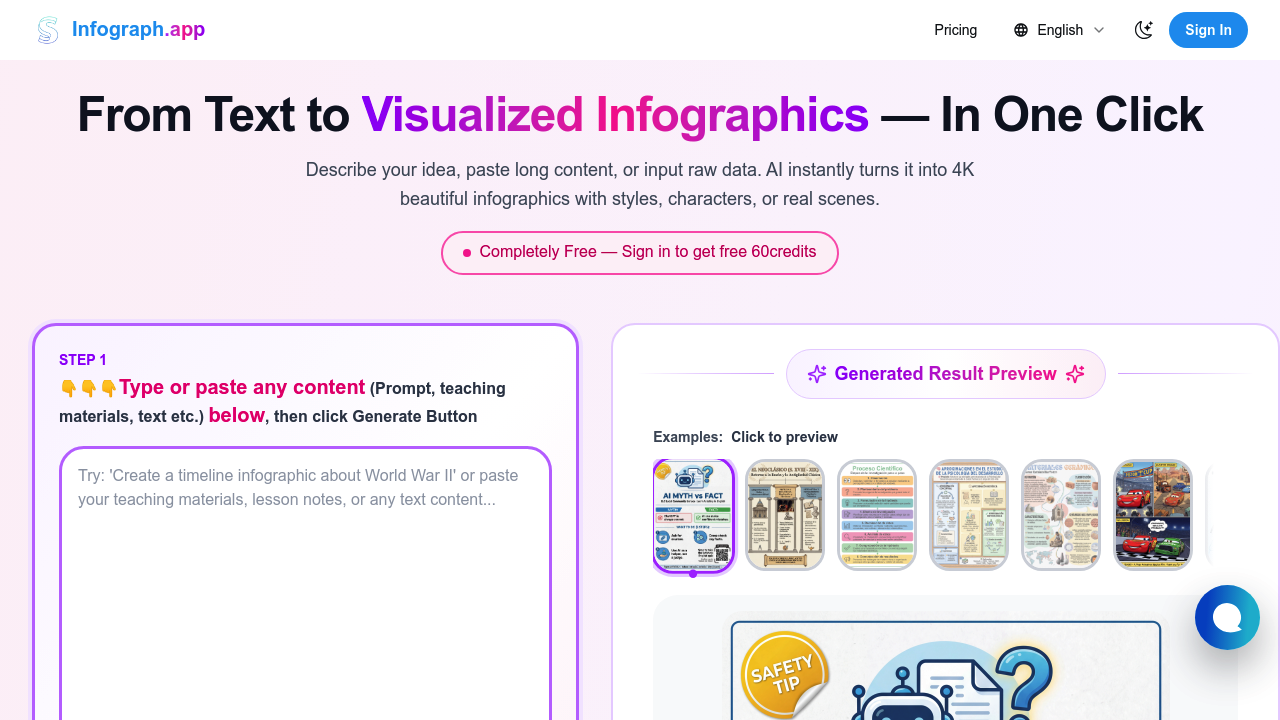
Text goes in. Infographics come out. Infograph.app converts your content into 4K visuals with one click — accepting everything from typed prompts to handwritten notes to raw data files. Feed it teaching materials, documents, or images. Watch it generate professional diagrams automatically.
Output options cover most visual needs. Flow charts. Org charts. Mind maps. Timelines. Comparison charts. Bar graphs. All render in crisp 4K resolution that works for presentations or social media posts. Whiteboard-style diagrams look clean enough for academic work.
Here's where it gets interesting: the AI Style Cloner can recreate designs from any infographic you upload. Upload a chart you like, and Infograph.app will mimic that visual style for your own data. It handles multiple languages and keeps text legible even in complex diagrams.
A middle school science teacher prepping a lesson on the water cycle could scan their handwritten notes and get back a polished diagram ready for the classroom projector.
No design skills required.
You get 60 free credits when you sign up. There's no mention of paid tiers, which raises questions about long-term availability once those credits run out. Infograph.app targets educators and content creators specifically, though anyone who needs quick visual content could find it useful. Converting messy data into something presentation-ready happens fast, but you'll want those free credits to last.