
VibeChart logo
AI Charting FREEMIUM from $20/mo

VibeChart

Analysts, researchers, and anyone drowning in spreadsheet hell needs VibeChart

This text-to-chart AI tool turns your written descriptions into visual charts without the usual Excel gymnastics. Type what you want to see. VibeChart generates the chart. Done. A market researcher prepping for Monday's…

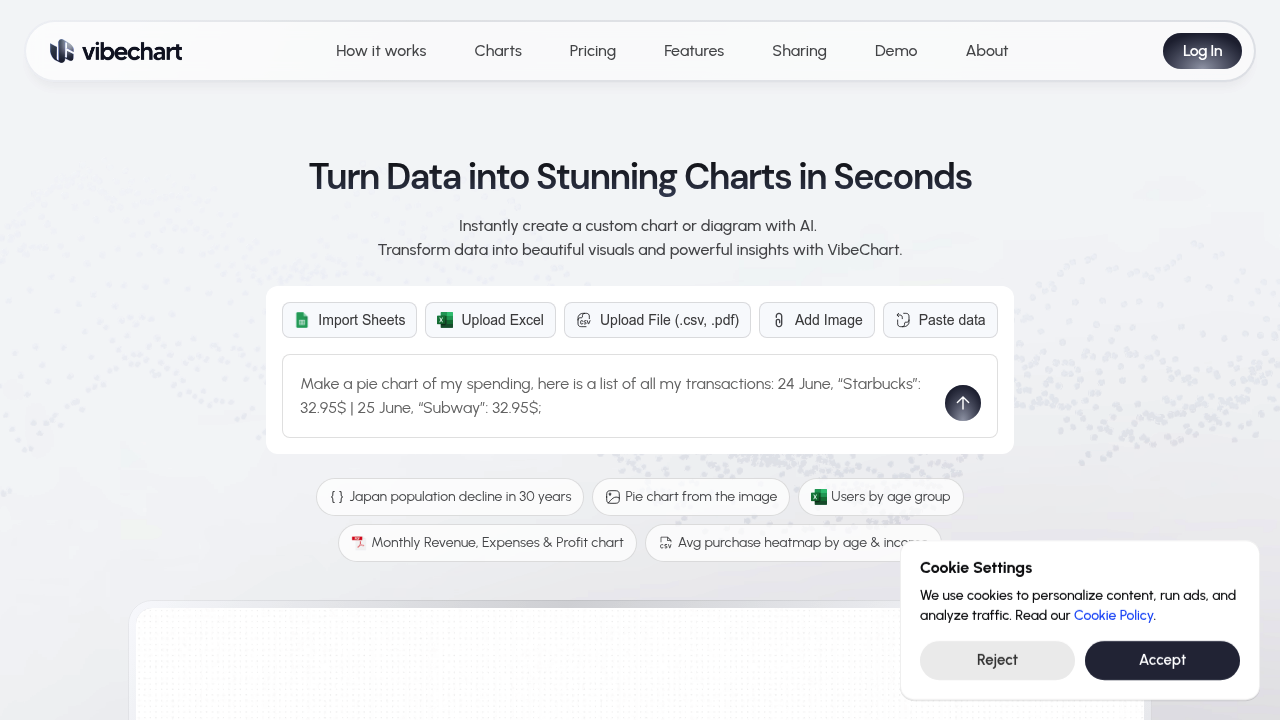
VibeChart screenshot

Analysts, researchers, and anyone drowning in spreadsheet hell needs VibeChart. This text-to-chart AI tool turns your written descriptions into visual charts without the usual Excel gymnastics.

Type what you want to see. VibeChart generates the chart. Done.

A market researcher prepping for Monday's presentation can describe survey findings in plain English and get polished visuals in seconds. No more wrestling with chart wizards. No formatting nightmares. You describe the data relationships — VibeChart handles the visualization heavy lifting.

Converting text to charts cuts out the tedious manual work of building from scratch. Instead of clicking through menus and adjusting axes, you explain what you need in natural language. VibeChart interprets your text and produces the corresponding visual. Charts that usually take twenty minutes now appear in moments.

Speed matters when deadlines loom and stakeholders want visuals yesterday.

VibeChart won't replace deep data analysis tools, but it's great at quick chart creation. Useful for reports. Presentations. Any situation where you need to visualize information fast.

It works best when you know exactly what story your data should tell. Feed it clear descriptions and you'll get clean charts. Vague input produces vague results, as expected with most AI text processing.


VibeChart alternatives

See all →

Frequently asked

7 questions
What types of charts can VibeChart create from text descriptions?
VibeChart can make standard business charts -- bar charts, line graphs, pie charts, scatter plots. Just tell it what you want in plain text. It's great for presentations and reports. Won't handle specialized scientific charts or complex custom stuff though.
How specific do I need to be when describing what chart I want?
Be specific, not vague. Include what data you're comparing, time periods, relationships you want to show. Like 'monthly sales growth for three product lines over 2023' beats 'show sales data.' Clear details = better charts.
Can I upload my own data to VibeChart or does it only work with descriptions?
It's text-only -- no data uploads. You describe your data relationships and values in natural language, then it builds the chart. Different from regular charting tools that need spreadsheet imports.
Does VibeChart let me edit the charts after they're generated?
Nope, it's built for quick generation, not editing. If you don't like the result, you'll need to tweak your description and try again. It's about speed -- not fine-tuning every little detail.
How does VibeChart compare to using Excel or Google Sheets for making charts?
VibeChart skips all the data entry and formatting headaches. No spreadsheets, no chart wizards -- just describe what you want in plain English. Faster for simple charts, but spreadsheets still win for complex analysis.
What happens if VibeChart doesn't understand my description correctly?
Time to rephrase with more details or clearer language. The AI likes structured descriptions with concrete data points. If it's way off, break your complex request into smaller, simpler pieces.
Is there a limit to how much data I can describe for VibeChart to visualize?
Keep it focused -- not massive datasets. Dozens of data points won't translate into clean visuals. Think presentation slide charts, not comprehensive dashboards. Less is more here.

Traffic

Estimated monthly website visits · last 0 months

461 visits/mo
Monthly visits
461

Not enough historical data for a chart yet.

Reviews (0)

Write review

No reviews yet. Be the first to share your experience.