
A financial analyst stares at a spreadsheet with 50,000 rows of transaction data. She needs to spot anomalies, generate trend charts, and create a summary dashboard for tomorrow's board meeting. She types "show me unusual spending patterns in Q3" into Excelmatic's chat interface. Within seconds, it flags outliers, builds a bar chart comparing quarters, and suggests a pivot table format. No VLOOKUP formulas. No pivot table wrestling. She gets her dashboard done in 20 minutes instead of three hours.
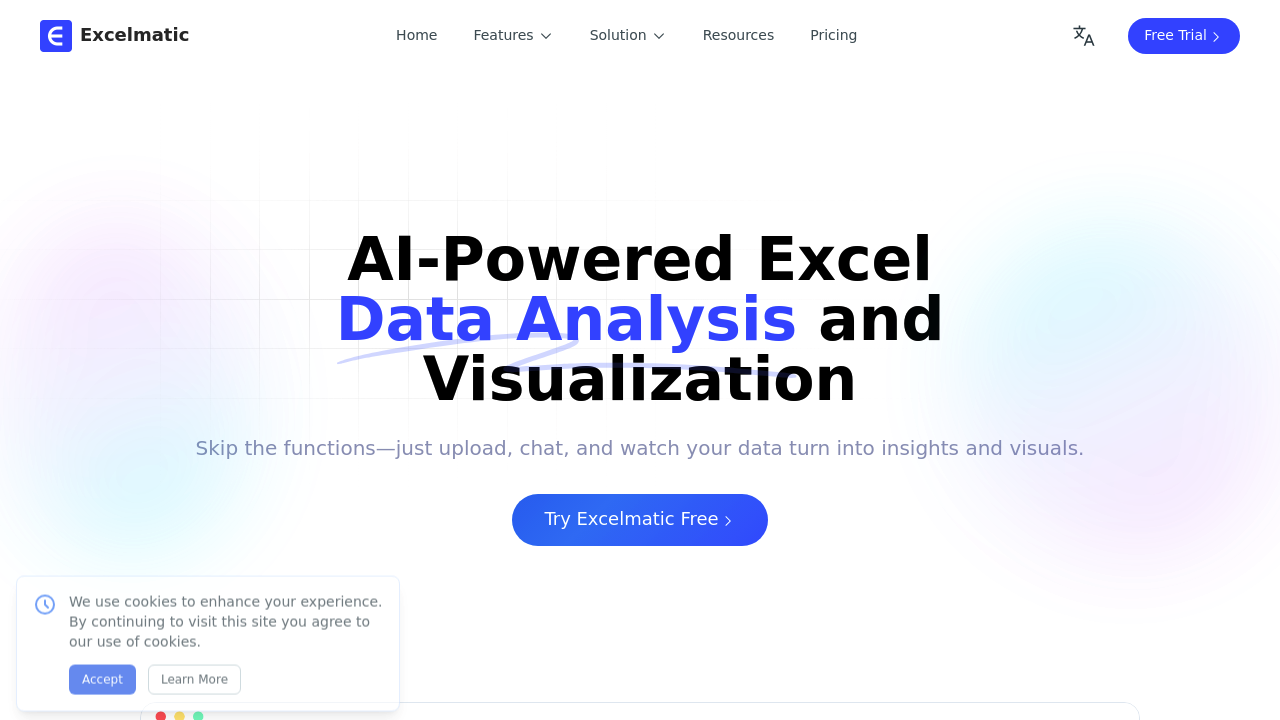
Excelmatic turns Excel files into conversation partners. Upload a .xlsx or .csv file, ask questions in plain language, and it analyzes data, builds visualizations, and extracts insights automatically. The AI Spreadsheet Assistant interprets requests like "create a sales forecast for next quarter" or "which products have declining margins" and executes the analysis without requiring users to write formulas. The system identifies data types automatically through intelligent recognition, figures out which chart formats work best for the data structure, and updates visualizations dynamically when underlying numbers change.
It handles nine distinct workflows. AI Data Visualization creates bar charts, pie charts, and line charts through conversational prompts. AI Image to Excel converts photos of printed tables into editable spreadsheets. AI PDF to Excel extracts table data from documents. AI Excel to Dashboard transforms static sheets into interactive visual interfaces. The Intelligent Formula Assistant generates complex nested formulas and array formulas from natural language descriptions, then detects errors and suggests fixes. Batch processing handles multiple tables simultaneously. Trend analysis and anomaly detection run automatically across datasets, while multi-dimensional analysis breaks down numbers by different variables without manual pivot configuration.
A supply chain manager uploads inventory data across 12 warehouses. He asks "which locations are overstocked on seasonal items" and gets a color-coded map with reorder recommendations. The system spots that three warehouses have 400% more winter coats than historical sell-through rates suggest they'll move. A marketing analyst converts a messy quarterly campaign report from PDF into Excel, asks for ROI by channel, and watches it build comparison charts showing email outperforming paid search by 34%. An e-commerce team lead takes a screenshot of competitor pricing from a website, feeds it into the image-to-Excel converter, then asks it to compare margins against their own catalog.
The system falls short for users who need to preserve complex manual formulas or work with proprietary Excel add-ins. It only accepts .xlsx and .csv formats, so Access databases or Google Sheets require conversion first. Teams using specialized financial modeling templates with custom macros won't find support here. It analyzes existing data but doesn't connect to live databases or APIs for real-time feeds beyond basic and advanced integrations included in paid tiers.
The free plan accommodates up to 3 users with unlimited pages and community support. Starter costs $49 monthly for 20 users and 20 custom domains with priority support. Business runs $149 monthly with unlimited custom domains and 99.99% uptime guarantees. Enterprise pricing is custom and packs SAML/SSO integration with dedicated account management and 24/7 phone support.
Excelmatic works best for finance teams drowning in monthly close processes, marketing analysts building recurring reports, and operations managers who need quick data snapshots without Excel expertise. It doesn't fit data scientists who need Python-level statistical control or teams whose workflows depend on Excel's full macro ecosystem.