
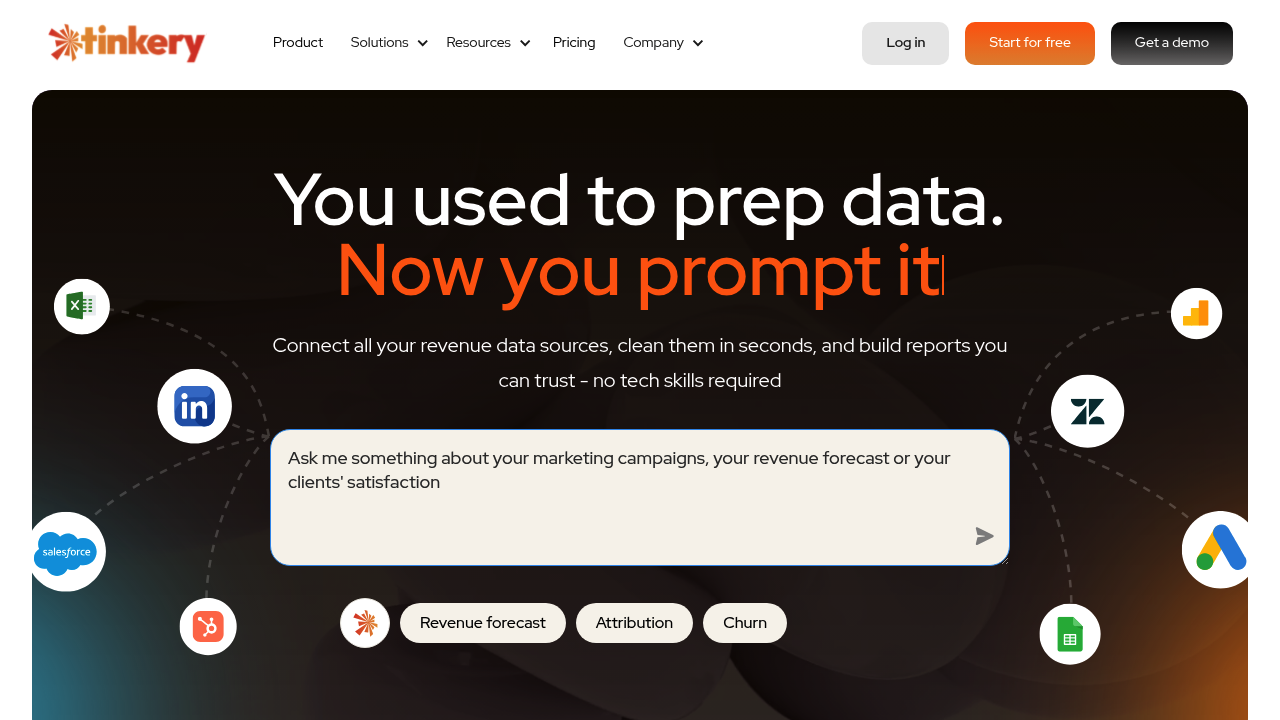
This revenue data platform converts natural language questions into analysis across marketing, sales, and customer experience datasets. The architecture pulls data from multiple sources, runs automated cleaning routines to fill gaps and standardize formats, then surfaces insights through an AI query interface that interprets prompts like "show me conversion rates by channel last quarter" without requiring SQL knowledge.
The data pipeline starts with connectors that pull from sources like Google Ads, Salesforce, and various marketing tools. Static file uploads work too. Once ingested, the cleaning engine identifies missing values, resolves formatting inconsistencies, and applies transformation rules through what Tinkery calls "recipes." These recipes define how raw data becomes analysis-ready without manual spreadsheet work. The system claims to cut manual cleaning time by over 80 percent.
Users query the unified dataset through natural language. Ask about churn patterns or revenue attribution, and the AI layer translates that into the appropriate queries across your connected sources. It's not generating creative content. It's interpreting intent and routing requests to structured data operations. The output includes dashboards, visualizations, and predictive scenarios that forecast outcomes based on historical patterns.
This system targets GTM teams specifically rather than serving as general-purpose business intelligence. That focus shapes the feature set. Revenue attribution tracking connects marketing spend to closed deals. Churn analysis identifies at-risk customers. Forecasting models predict pipeline movement. These are not generic analytics capabilities adapted for sales contexts. They're built around GTM workflows from the start.
Multi-user collaboration lets teams share dashboards and data models. The Pro tier supports unlimited projects and data sources with 20 GB storage. Agency plans add central branching for managing multiple client accounts, plus API export for programmatic access to visualizations. Enterprise deployments include custom AI tuning to adapt the query interpretation layer to specific business terminology and admin controls for governing team access.
Integration depth varies. Google Ads and Salesforce connect directly. Marketing, sales, and customer experience tools integrate broadly, though specific platforms aren't detailed. The free tier restricts integrations to static files only. Pro and above connect to any data source, suggesting either a library of pre-built connectors or custom integration support.
The free plan imposes practical constraints. One project per user means you can't separate staging from production environments or manage multiple business units. Three data sources per project will not cover complex tech stacks. Twenty AI queries daily runs out fast during heavy analysis sessions. One gigabyte storage fills quickly with months of historical data. Basic visualizations exclude advanced chart types available in paid tiers.
No mobile app or browser extension exists based on available information. Access appears web-based through the main interface. API export on Agency and Enterprise plans lets you pull graph data programmatically, but that's different from a full API for system control.
The natural language interface represents the core technical bet. Traditional BI tools require learning query languages or drag-and-drop report builders. This approach interprets conversational requests instead. The quality depends entirely on how well the AI layer understands GTM terminology and maps vague questions to precise data operations. That's hard to evaluate without hands-on testing across edge cases and ambiguous prompts.