
You can start using Magic Vizion without paying anything upfront. The free plan gets you access to their AI-powered data visualization tools. Specific limits aren't detailed on their site.
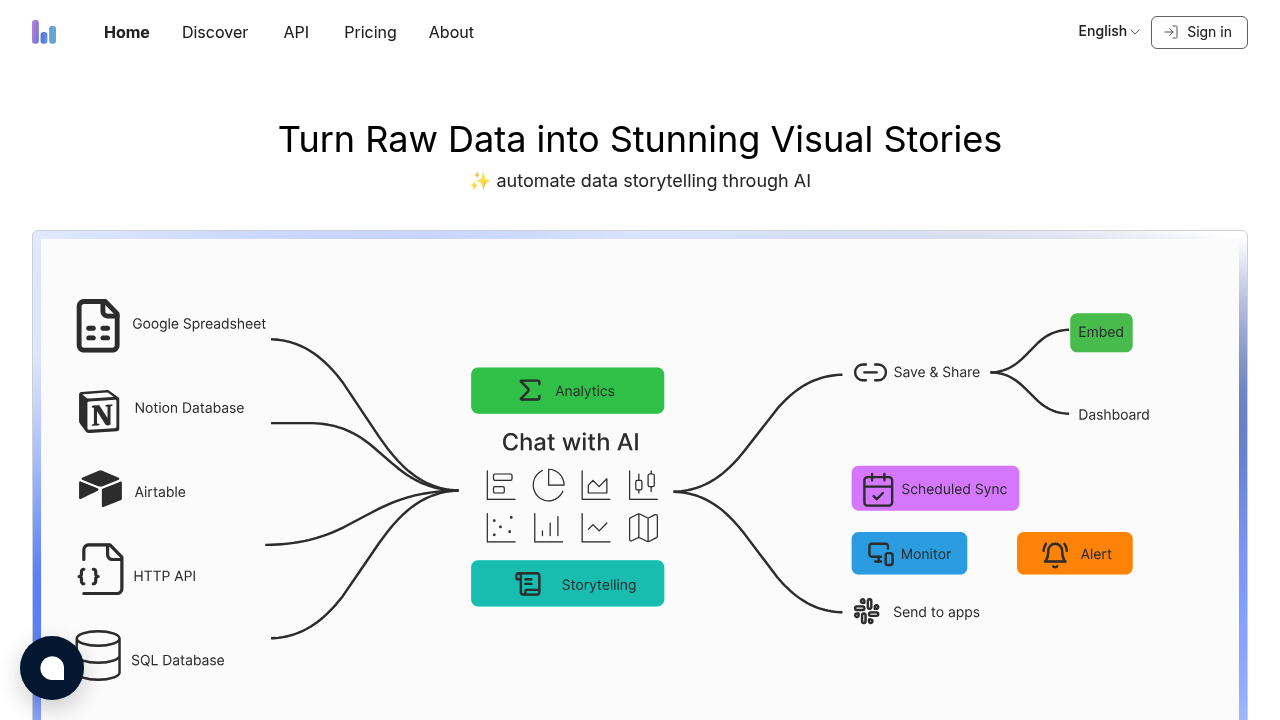
Over 12,000 professionals already use Magic Vizion to turn spreadsheets into visual stories. It connects directly to Google Sheets. Notion. Airtable. Various databases too. You ask questions in plain English through their AI chat feature. Magic Vizion responds with charts and graphs instead of text answers.
Think of a marketing director preparing quarterly reports. They can link their campaign data from multiple sources, ask "Which channels drove the most conversions last month?" and get an interactive dashboard. The AI even writes titles and summaries for each visualization.
The design interface mimics Canva's drag-and-drop simplicity. Charts update automatically when your underlying data changes — dashboards stay current without manual work. You can export visualizations as PNG, SVG, or CSV files.
Magic Vizion's API feature works well for teams that create similar reports regularly. It replicates graph templates with fresh data and generates shareable URLs instantly. Great for consultants who need consistent formatting across client presentations.
The embed functionality includes iframe codes and domain whitelisting, though this protection feature might feel restrictive if you're sharing visualizations across multiple platforms. Charts work on both desktop and mobile. But the design interface clearly favors larger screens for detailed dashboard creation.