
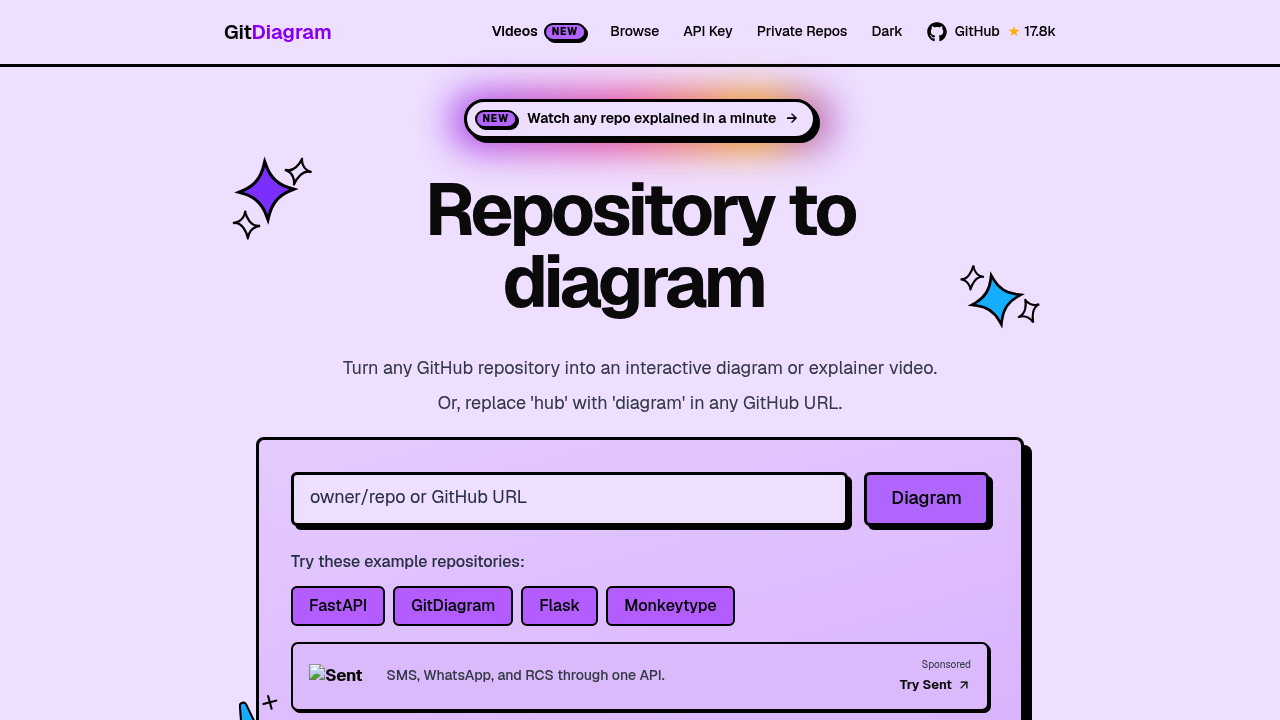
GitDiagram converts a GitHub repository into an interactive diagram of its architecture. Paste a repository link, or simply swap 'hub' for 'diagram' in any GitHub URL, and a visual map of the codebase appears. A newer option generates a short explainer video that walks through a repository in about a minute, so the structure of a project can be absorbed without reading file after file. The project is open source on GitHub, where it has collected around 17.8k stars, and the home page offers example repositories such as FastAPI, Flask and Monkeytype to try right away.
Developers joining a new team are the clearest audience: a diagram of an unfamiliar service helps them see which parts talk to each other before they open an editor. Open source contributors use it to scope a project before sending a first pull request, and maintainers can share a diagram with newcomers as a visual orientation. Engineering managers, technical writers and students studying real-world projects also get a quick overview without cloning anything.
Common scenarios include onboarding to a legacy codebase, preparing for a technical interview that involves an open source project, reviewing a dependency before adopting it, and writing documentation that needs an architecture picture. Because the URL trick works from any repository page, it fits into normal browsing: you notice an interesting project, change one word in the address, and get a diagram. The explainer video suits teammates who prefer watching a summary to reading one, and it can be passed around to explain how a repository fits together. Because the output is a visual map, it also works well as a conversation starter in design reviews, planning sessions and pair programming, where everyone can point at the same components. The generated diagrams give a first mental model, which you can then confirm by reading the files that matter most.