
CodeViz logo
AI Diagram Generator FREEMIUM from $19/mo

CodeViz

The free tier caps you at five diagrams monthly and one repository

Beyond that? You'll pay $19 per month for Pro or $50 per seat for Teams. Staring at a massive codebase is painful. You're trying to figure out where everything connects. CodeViz generates architecture diagrams…

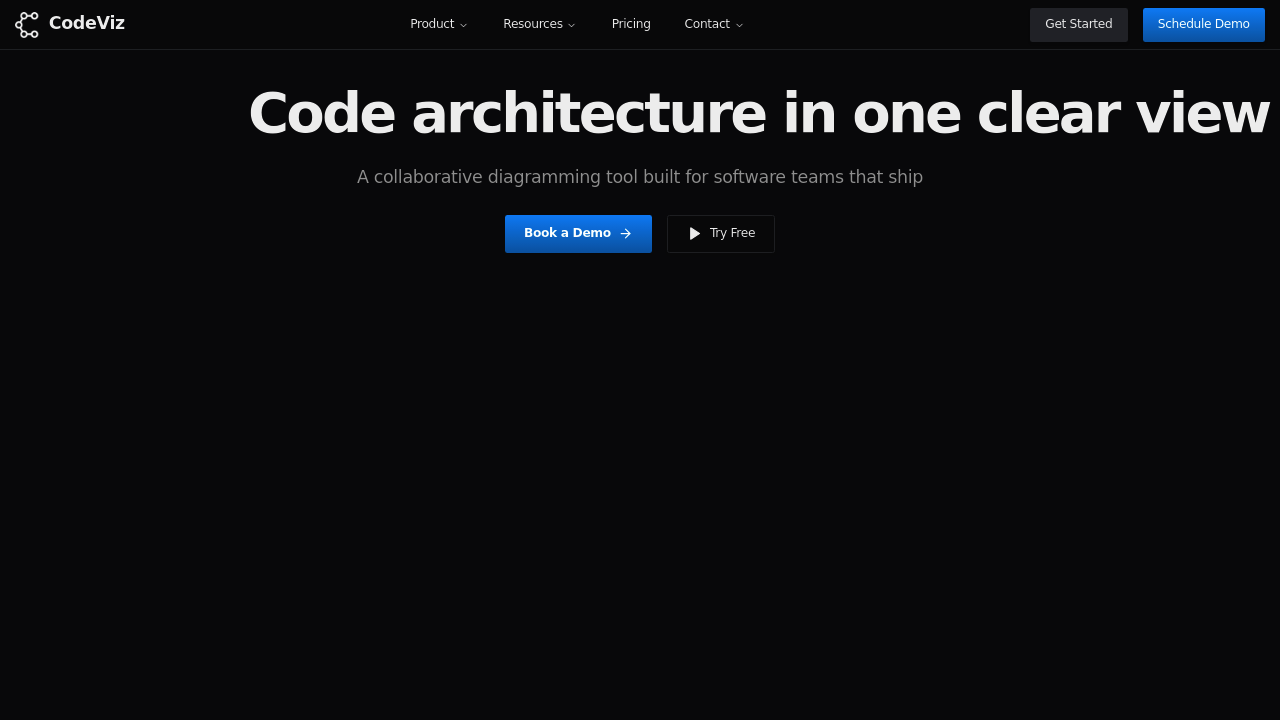
CodeViz screenshot

The free tier caps you at five diagrams monthly and one repository. Beyond that? You'll pay $19 per month for Pro or $50 per seat for Teams.

Staring at a massive codebase is painful. You're trying to figure out where everything connects. CodeViz generates architecture diagrams automatically—it analyzes your code and creates multi-level maps. These follow the C4 model (context to container to component to code level). Ask questions in plain English. Get contextual views of specific workflows or data flows.

CodeViz works across major programming languages. It keeps documentation synced with your actual code. Someone opens a PR? You can visualize exactly what changed instead of mentally reconstructing impact from diffs.

Picture this: a backend engineer inherits a microservices mess. They ask "show me the authentication flow" and get a diagram linking back to source. Edit these diagrams—they stay connected to the codebase.

Real-time collaboration requires Teams plan. Cross-repository visualization does too (if you're dealing with multiple codebases). Export everything to Mermaid or draw.io or PNG. Embed diagrams in Notion and Confluence. Store versions in Git so architecture updates go through the same review process as code.

C4 and UML standards mean you're not learning some proprietary diagram language. CodeViz integrates with VS Code and GitHub and Jira and Slack. Over 70k developers use it apparently.

The promise? Saving ten hours monthly by not manually drawing boxes that go stale immediately.

CodeViz alternatives

See all →

Frequently asked

7 questions
How much does CodeViz cost?
CodeViz has a free plan with 5 diagrams per month and 1 repository. Pro costs $19/month for unlimited diagrams and faster processing. Teams is $50/seat/month and adds real-time collaboration plus cross-repository views.
Does CodeViz work with my programming language?
Yeah, it supports all major programming languages. The tool analyzes your codebase automatically regardless of whether you're working in Python, Java, JavaScript, Go, or whatever else you're using.
Can I use CodeViz for free?
Yes, the free plan gives you 5 diagrams per month on 1 repository. You get architecture visualization, natural language queries, and exports to Mermaid, draw.io, or PNG. That's enough to try it out and see if it clicks with your workflow.
What's the difference between CodeViz Pro and Teams?
Pro ($19/mo) gets you unlimited diagrams, faster processing, and more repositories. Teams ($50/seat/mo) adds real-time collaboration so multiple people can work together, plus cross-repository architecture views for complex systems.
How does CodeViz keep documentation updated with code changes?
It syncs automatically with your codebase instead of creating static diagrams. When code changes, your architecture maps reflect those updates. You can even visualize PR changes to see exactly what's being modified before merging.
Can I use CodeViz to understand a codebase I just inherited?
That's exactly what it's built for. Ask questions like "show me the authentication flow" in plain English and get diagrams that link back to the actual source code. Way faster than reading through thousands of lines trying to piece things together yourself.
What integrations does CodeViz support?
It integrates with VS Code, GitHub, Jira, Slack, Figma, Notion, and Confluence. You can embed diagrams directly in your docs and keep everything connected to your existing workflow.

Traffic

Estimated monthly website visits · last 9 months

3.4K visits/mo
Monthly visits
3.4K
↓ 44.8% MoM
Global rank
#4,939,424
US #2,544,583
Category rank
#12
AI Diagram Generator
6.4K 5.5K 4.5K 3.5K 2.5K Nov 2025: 4.2K visits Nov 2025 Dec 2025: 6.4K visits Dec 2025 Jan 2026: 2.7K visits Jan 2026 Feb 2026: 2.5K visits Feb 2026 Mar 2026: 6.3K visits Mar 2026 Apr 2026: 3.3K visits Apr 2026 May 2026: 2.5K visits May 2026 Jun 2026: 6.2K visits Jun 2026 Jul 2026: 3.4K visits Jul 2026

Reviews (0)

Write review

No reviews yet. Be the first to share your experience.