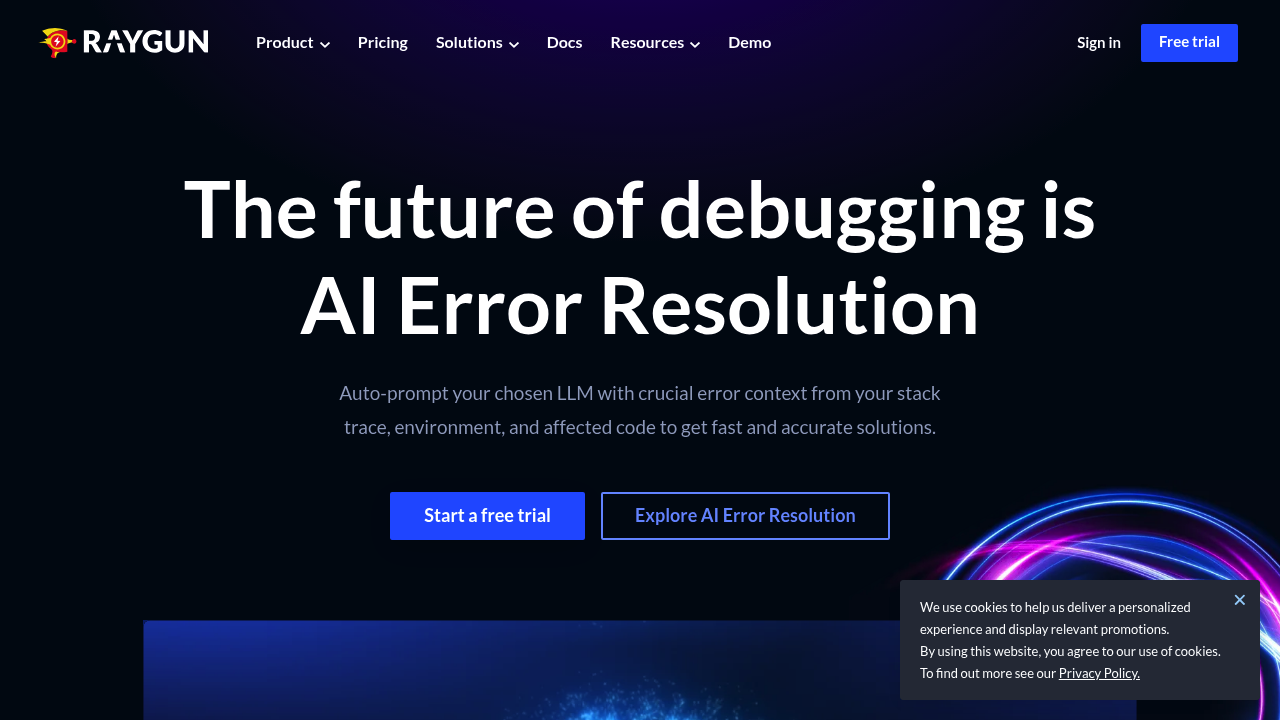
Application crashes and performance issues cost companies real users — 53% of consumers abandon apps after encountering freezes or errors. Raygun addresses this through a unified monitoring platform that combines Crash Reporting, Real User Monitoring, and Application Performance Monitoring. This solution captures complete request lifecycles with code-level context and multithreaded trace support, helping teams reduce errors in checkout processes by up to 90% and cut mean time to resolution to as low as 4 minutes. Its AI Error Resolution feature automatically prompts language models with stack traces, environment details, and affected code to accelerate debugging. Pricing starts at $40 per 100,000 errors monthly on the Basic plan, scaling to $80 for 200,000 errors on Team, $400 for 1,000,000 errors on Business, with custom Enterprise arrangements available. All tiers include unlimited apps, members, and customer records, with a 14-day trial across plans.
Development teams, tech leads, site reliability engineers, and performance analysts working in companies from startups to Fortune 500 organizations rely on Raygun for production monitoring. This system serves cross-functional groups including CX experts who track how technical issues affect user experience and analysts who need visibility into performance trends. Teams managing mobile and web applications benefit from deployment tracking and custom dashboards, while those handling sensitive data appreciate HIPAA, GDPR, CCPA, and PCI compliance with encrypted storage. Organizations processing billions of data points daily use Raygun's spike protection and usage capping to manage monitoring costs predictably.
Engineering teams integrate Raygun into existing workflows through connections with Slack, Github, Jira, Bitbucket, and Teams, receiving alerts when errors spike or new deployment issues emerge. Performance engineers use Real User Monitoring to track Core Web Vitals scores and page response times, identifying bottlenecks that affect conversion rates. SREs configure inbound filters to focus on critical error categories and set up custom dashboards showing system health across multiple applications. Development shops use deployment tracking to correlate releases with error patterns, while quality assurance teams attach screenshots and session data to crash reports for faster reproduction. The API enables teams to build custom integrations and automate incident response workflows, fitting into continuous deployment pipelines where quick resolution directly impacts revenue.