
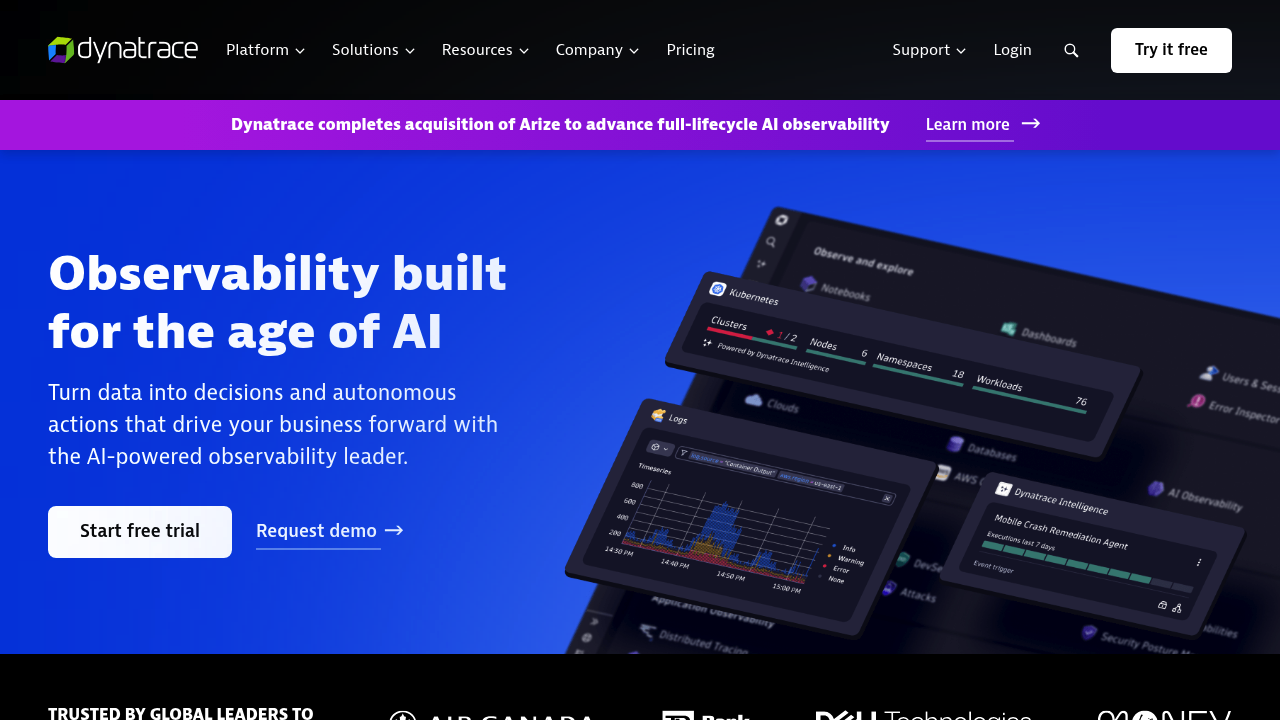
Dynatrace is an observability platform that combines application performance monitoring, infrastructure monitoring, log analytics, digital experience monitoring and application security in one place. Its Dynatrace Intelligence layer uses deterministic AI to find root causes and drive automated actions, and its Grail data lakehouse analyzes data in context. A dedicated AI Observability capability covers generative AI apps, LLMs and agents. Pricing is commitment-based with a rate card, for example $7 per month per host for Foundation and Discovery and $29 per month per host for Infrastructure Monitoring, and a 15-day free trial is offered.
Dynatrace is aimed at DevOps engineers, site reliability engineers, platform teams and security groups in mid-size and large organizations that run cloud-native and enterprise stacks. Executives and product teams use business observability to turn real-time data into decisions, while developers troubleshoot live code in production from Visual Studio Code or JetBrains. Customers cited include Air France-KLM, ADT, Next and WeLab Bank. Teams that want to consolidate several monitoring tools under a single annual commitment find that single-commitment pricing model appealing.
Common scenarios include tracing a slow checkout across microservices to the exact line of code, monitoring Kubernetes clusters with per-pod visibility, and cutting the time to identify root causes from hours to minutes, as WeLab Bank reports. Security teams discover and prioritize vulnerabilities in running applications. AI teams watch the cost and behavior of LLM apps and agents. Operations teams analyze logs alongside traces in context, forecast consumption, and automate remediation with agentic workflows. Trace data is kept for 10 days by default and can be extended to 10 years, and Dynatrace ingests OpenTelemetry metrics and traces.