
Analytify logo

Analytify

You connect Analytify to your database

Insights start flowing immediately. The AI handles heavy lifting while you focus on decisions. Deploy takes five minutes — cloud-hosted or self-hosted options both work. The interface feels clean without usual BI bloat.…

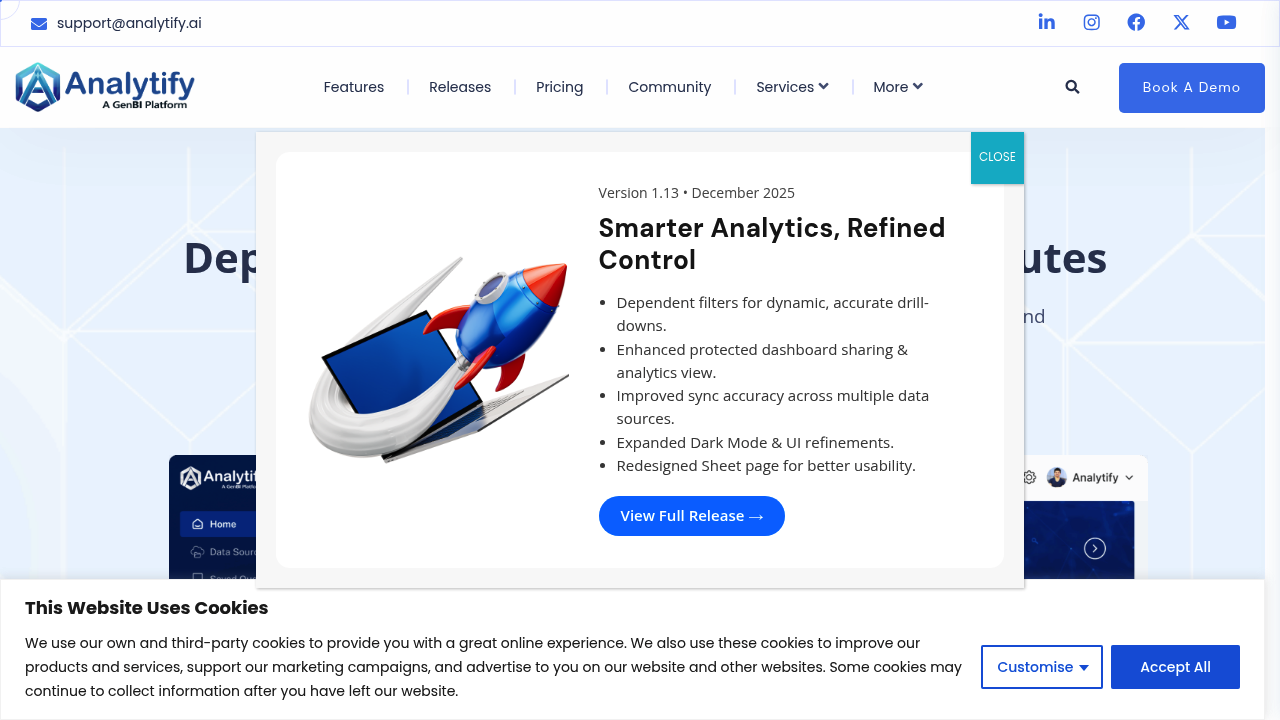
Analytify screenshot

You connect Analytify to your database. Insights start flowing immediately. The AI handles heavy lifting while you focus on decisions. Deploy takes five minutes — cloud-hosted or self-hosted options both work.

The interface feels clean without usual BI bloat. No slowdowns like other platforms. Dark mode helps during late-night data sessions. GenieAIQ transforms your queries into visualizations that actually make sense. Dependent filters let you drill down dynamically. No rebuilding dashboards from scratch.

A retail operations manager analyzing customer behavior patterns can track purchase flows across multiple touchpoints. Set up protected dashboard sharing so stakeholders see real-time metrics without accessing raw data.

The AI spots trends you might miss manually.

Over 400 companies already use Analytify instead of Tableau or Power BI. No vendor lock-in means you can export everything if needed. Self-hosted deployments appeal to companies with strict data governance requirements. Healthcare organizations keep patient analytics on-premises. Finance teams sync multiple data sources for compliance reporting. The open-source foundation means technical teams can customize features without waiting for vendor updates.

The 14-day trial doesn't require a credit card upfront. You'll know quickly if Analytify fits your workflow better than existing options. Some teams find the open-source model requires more technical involvement than plug-and-play solutions.


Analytify alternatives

See all →

Frequently asked

6 questions
How does GenieAIQ in Analytify work compared to traditional query builders?
GenieAIQ just takes what you say and turns it into charts -- no SQL needed. You don't mess around building complex queries manually. Just ask something like 'show me sales trends by region' and boom, you get charts instantly. The AI figures out your data connections on its own.
What's the difference between Analytify's cloud-hosted and self-hosted options?
Cloud version gets you up and running in five minutes flat. No infrastructure headaches. Self-hosted? That's where you get total control over everything -- it's built on open-source so you can tweak whatever you want. Healthcare and finance folks usually go self-hosted (compliance stuff), but smaller teams just want the cloud version.
Can I customize Analytify features or am I stuck with what's provided?
You're definitely not stuck. The open-source foundation means your tech team can modify and extend features without waiting around for vendor updates. Unlike Tableau or Power BI where you're locked in -- if you need something specific, your developers can just build it right into the platform.
How does protected dashboard sharing work for sensitive data?
You can share live dashboards with stakeholders while keeping them away from your actual database. They see real-time metrics and can play with filters, but they can't touch the underlying data sources. Perfect for executive reporting -- they get visibility without seeing sensitive stuff.
What happens if I want to leave Analytify later?
No vendor lock-in here. You can export everything -- dashboards, queries, configurations, the works. That's way different from platforms that trap your work in their proprietary formats. Your data stays yours, and if your needs change, migration's actually doable.
Does the 14-day trial give me access to all features?
Yep, full access without needing a credit card upfront. You can test GenieAIQ, set up dashboard sharing, connect your real data sources -- everything. Most teams figure out pretty quick whether it beats their current BI tools.

Traffic

Estimated monthly website visits · last 6 months

850 visits/mo
Monthly visits
850
↓ 38.3% MoM
Global rank
#11,097,305
Category rank
#31
AI For Data Analytics
2.2K 1.7K 1.2K 713 214 Nov 2025: 1.3K visits Nov 2025 Dec 2025: 214 visits Dec 2025 Jan 2026: 2.2K visits Jan 2026 Feb 2026: 801 visits Feb 2026 Mar 2026: 1.4K visits Mar 2026 Apr 2026: 850 visits Apr 2026

Reviews (0)

Write review

No reviews yet. Be the first to share your experience.